Exporter#
This page explains how to configure settings from the menus and panels, including related property dialogs, and how to create animations and export data. For information on preview controls, see the 3D Viewer page.
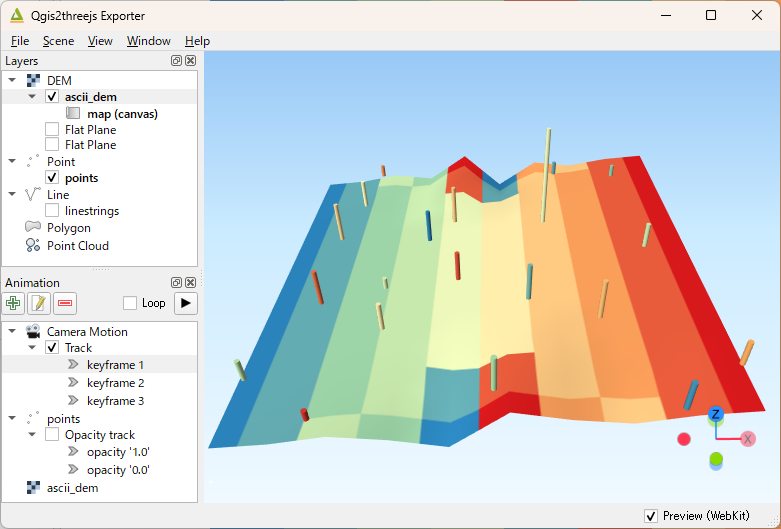
Qgis2threejs Exporter#
In this plugin, the word “export settings” refers to all configuration settings for a 3D scene and its viewer application. These include settings for the scene, camera, layers to be exported, animations, widgets on the web page, and more.
Export settings are automatically saved to a .qto3settings file alongside the current QGIS project file when you are working
with a QGIS project. When the exporter is opened later, the project’s export settings are automatically restored.
The preview is automatically updated whenever export settings are changed. You can disable the preview by unchecking the Preview checkbox in the lower-right corner of the window.
Warning
If you open export settings saved with a newer version in an older version, an error may occur and the properties dialog may not open. In this case, clear the export settings from the File menu.
Layer Panel#
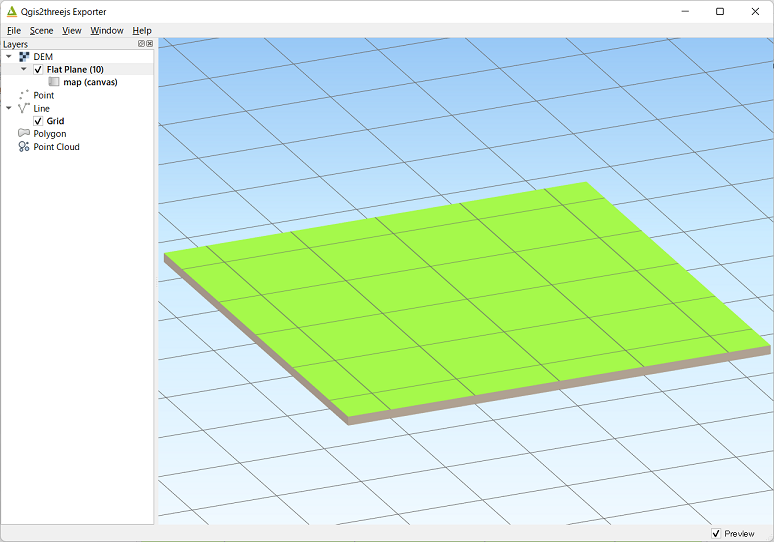
The Layers panel displays single-band raster and vector layers loaded in QGIS, as well as point cloud layers (partially supported) and flat planes. Unlike the QGIS layer tree, layers are grouped by type. Each layer item has a checkbox on the left. Click the checkbox to add the layer to the current scene. To open the layer properties dialog, double-click the layer item or click Properties… from the context menu (right-click menu).
You can also select Zoom to layer objects from the context menu. This action moves the camera to a position some distance away from the center of the layer’s bounding box and orients the camera to look toward that center. This action is useful when no objects are visible in the scene or when the camera position or orientation becomes difficult to control, as it resets the camera and its focal point to a reasonable location.
Scene Settings#
Scene settings dialog controls some basic configuration settings for current scene.
Click on Scene - Scene Settings... menu entry to open the dialog.
World#
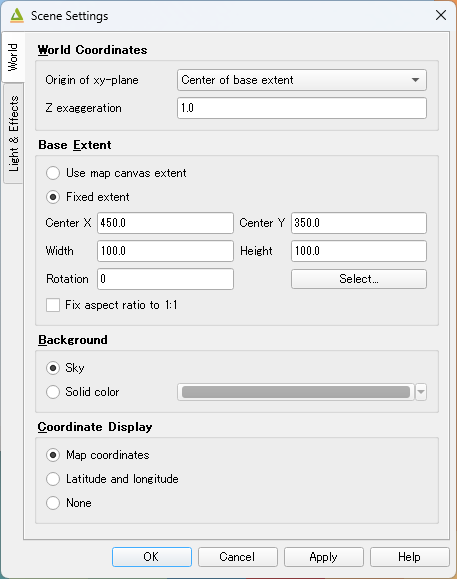
Scene Settings Dialog - World Tab#
World Coordinates#
- Origin of xy-plane
Specifies where the origin point of the XY plane is located.
- Center of base extent
Sets the center of the base extent defined below as the origin of the XY plane. Shifting the origin in this way helps maintain numerical precision when coordinate values are very large.
- Origin of map coordinate system
Uses the original origin defined in the map coordinate system as the XY plane origin.
- Z exaggeration
Specifies the vertical exaggeration factor. This value affects terrain shape and the Z positions of all 3D vector objects. It also affects the height of certain volumetric 3D shape types.
- The following shape types are affected:
- Point : Cylinder, Cube, ConePolygon : Extruded
- The following shape types have volume, but their heights are not affected by this factor:
- Point : SphereLine : Pipe, Cone, Box
The default value is 1.0.
Base Extent#
Defines the spatial extent used as the base area for the scene.
Select how the base extent is determined:
- Use map canvas extent
Uses the current visible extent of the map canvas as the base extent. The extent automatically updates according to changes in the map view.
- Fixed extent
Uses a manually specified extent as the base extent. This option allows you to maintain a constant area regardless of changes in the map canvas view. The extent values can be set using the extent of a specific layer or by interactively selecting an area on the map canvas.
Additional option:
- Fix aspect ratio to 1:1
Keeps the width and height of the base extent at a 1:1 ratio. This option is checked by default since version 2.7.
Background#
Selects either a sky-like gradient or a solid color for the scene background. The default setting is Sky.
Display of coordinates#
If the Latitude and longitude (WGS84) option is selected, the coordinates of
the clicked position on a 3D object are displayed as longitude and latitude (WGS84).
If Proj4js does not support current the map CRS,
this option is disabled.
Light & Effects#
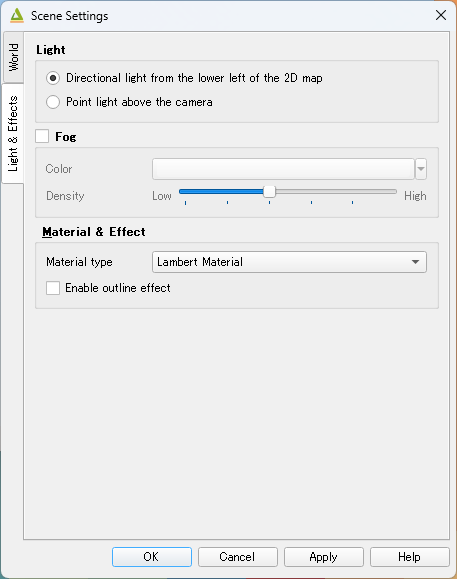
Scene Settings Dialog - Light & Effects Tab#
Light#
Selects the light source used to illuminate the scene.
- Directional light from the lower left of the 2D map
Simulates parallel light rays coming from the lower-left direction of the 2D map (the map displayed in the map canvas view).
- Point light above the camera
Simulates a point light source located above the camera position.
Fog#
Controls the fog effect applied to the scene.
- Color
Specifies the color of the fog.
- Density
Specifies the density of the fog. Higher values increase the fog effect and reduce the visibility of distant objects.
Material & Effects#
- Basic material type
Specifies the material type applied to most 3D objects, except for Point, Billboard, Model File and Line-type objects. Select a material type from Lambert material, Phong material or Toon material. The default is Lambert material.
- Enable outline effect
Enables an outline effect around 3D objects, making object shapes more visually distinguishable.
Camera Settings#
- Perspective Camera
Renders closer objects as larger and farther objects as smaller, creating a realistic sense of depth.
- Orthographic Camera
The rendered object size does not depend on the distance from the camera.
Perspective camera |
Orthographic camera |
|
|
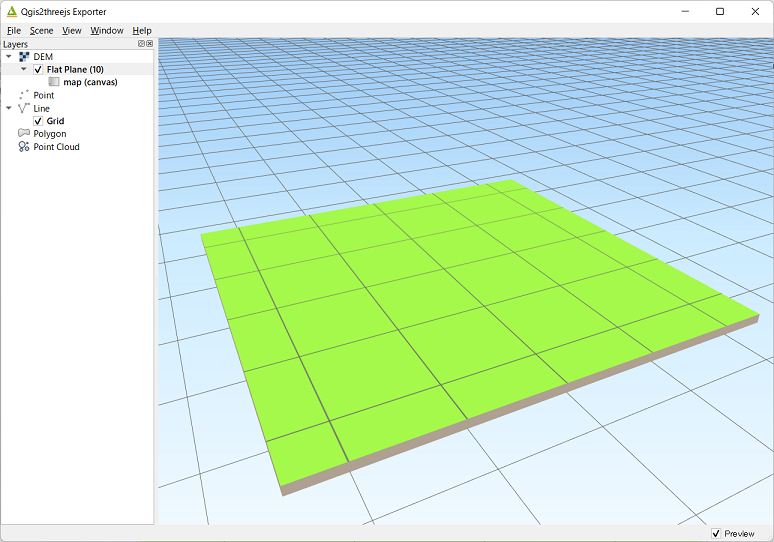
Widgets#
North Arrow#
Adds an arrow at the lower-left corner of the 3D view indicating grid north, which corresponds to the north direction of the map coordinate system.
DEM Layer#
Geometry#
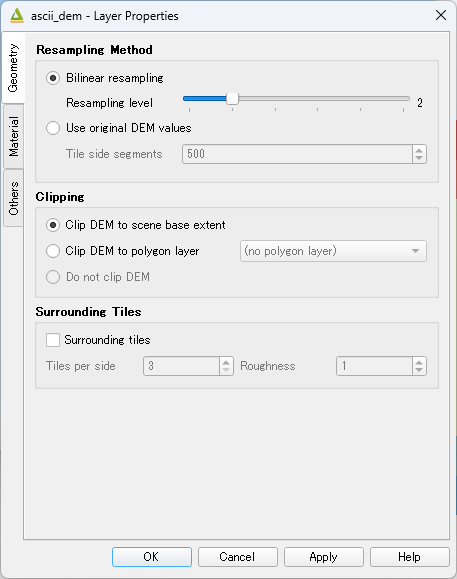
DEM Layer Properties Dialog - Geometry Tab#
Resampling Method#
Specifies how DEM elevation values are resampled when generating the 3D terrain mesh. Bilinear resampling is used by default.
- Bilinear resampling
Resamples DEM elevation values using bilinear interpolation. This method calculates elevation values by interpolating between neighboring pixel values. When this option is selected, a terrain mesh covering the scene base extent is generated at a resolution determined by the resampling level.
- Resampling level
Selects the resolution level used when resampling the DEM. Lower resolution levels reduce the number of elevation samples and improve performance, while higher resolution levels preserve more terrain detail but may increase processing time and data size. This setting affects only the terrain geometry and does not affect texture resolution.
- Use original DEM values
Uses the original DEM elevation values without interpolation. The DEM is divided into tiles.
This option cannot be used if the CRS of the DEM layer differs from the project CRS, or if the DEM grid spacing differs between the x and y directions. In addition, terrain objects will not be displayed if the map in the map canvas is rotated.
- Tile side segments
Specifies the number of segments along each side of a terrain tile.
Clipping#
Specifies how the DEM is clipped before generating the 3D terrain.
- Clip DEM to scene base extent
Clips the DEM to match the extent of the scene base. Only elevation data within the scene base area is used to generate the terrain.
- Clip DEM to polygon layer
Clips the DEM using the selected polygon layer. Only elevation data inside the polygon features are used to generate the terrain.
This option is useful when you have a polygon layer that represents the area where elevation data exists or defines specific regions such as drainage basins or administrative boundaries.
This option is unavailable when Use original DEM values is selected.
- Do not clip DEM
Uses the full extent of the DEM without clipping.
This option may increase data size and memory usage if the DEM size is large. Please choose this option carefully.
This option is unavailable when Bilinear resampling is selected in Resampling Method.
Surrounding Tiles#
This option enlarges the output DEM by placing additional DEM blocks around the main block corresponding to the scene base extent.
The size can be selected from odd numbers ranging from 3 to 9. For example, if you select 3, a total of 9 (3 × 3) blocks — one center block and eight surrounding blocks — are generated.
Roughness can be selected from powers of two ranging from 1 to 64. For example, if you select 2, the grid point spacing of each surrounding block is doubled. This means that the number of grid points within the same area becomes one quarter.
This option is unavailable when Use original DEM values is selected.
Material#
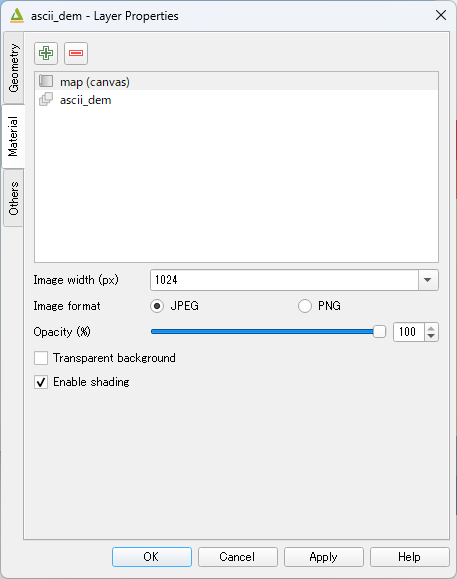
DEM Layer Properties Dialog - Material Tab#
The material list contains one item, map (canvas), by default.
Material List#
You can add a material to the list by clicking the + button and selecting one of the following items from the popup menu: Map Canvas Layers, Select Layer(s), Image File, or Solid Color.
- Map canvas layers - map (canvas)
Renders the same layers that are drawn in the map canvas according to the current project settings and uses the rendered result as a texture image.
- Select Layer(s) - Layer Image
Renders a texture image with the selected layer(s) for each DEM block.
- Image file
Applies an existing image file, such as PNG or JPEG, as a texture to the main DEM block. TIFF is not supported by some browsers. See Image format support for details.
- Solid color
Uses a single color. Click the button on the right to choose a color.
Settings for each material item#
- Image width (px)
Specifies the width of the image draped over each DEM block. The default value is 1024.
Available when a map canvas layers or layer image item is selected.
- Opacity
Sets the opacity of the DEM object. 100 is fully opaque, and 0 is fully transparent.
- Transparent background
Makes the image background transparent.
Available when a map canvas layers or layer image item is selected.
- Enable shading
Adds a shading effect to DEM surface. Enabled by default.
Others#
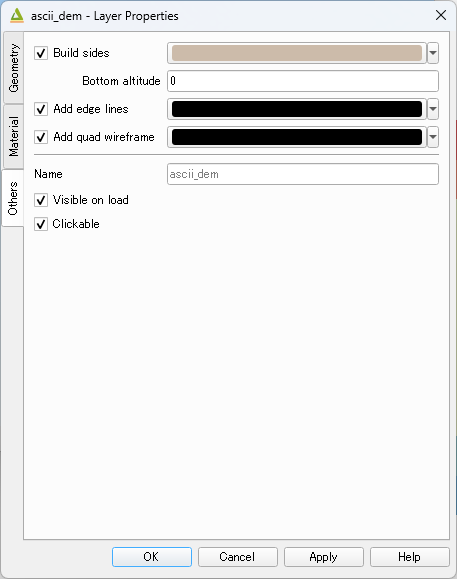
DEM Layer Properties Dialog - Other Options Tab#
- Build sides
Adds side faces and a bottom face to each DEM block using the selected color. The Z position of the bottom face is controlled by the Bottom altitude setting, which becomes available when this option is selected.
- Add edge lines
Adds outline edges to the side and bottom faces of each DEM block using the selected color.
- Add quad wireframe
Adds a regular grid wireframe that represents the terrain mesh structure using the selected color.
- Name
Specifies the name of the DEM layer as displayed in the layer list on the exported page.
- Visible on Load
Specifies whether the layer is visible when the exported page is loaded.
- Clickable
Enables user interaction with the layer. When enabled, the layer can respond to click events, such as displaying information about the clicked position or triggering actions.
Vector Layer#
Styling#
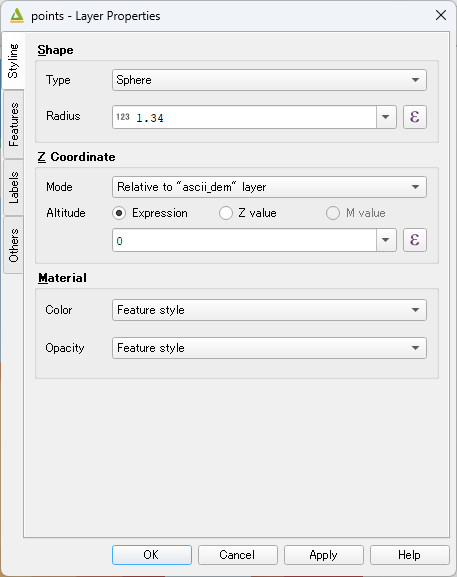
Vector Layer Properties Dialog - Styling Tab#
Shape#
- Type
Selects the shape type. The available shape types vary depending on the layer type (Point, Line, or Polygon). For details, refer to the Shape Types page.
- Shape Type Specific Properties
Displays properties specific to the selected shape type, such as height, radius, and other related settings.
Z Coordinate#
- Altitude Mode
Defines how the Z position of objects is calculated.
- Absolute
The Z position is calculated as the vertical distance above the zero level.
- Relative to (a DEM layer)
The Z position is calculated as the vertical distance above the surface of the selected DEM layer.
- Altitude
Defines how the Z position is derived using geometry Z values, M values, expressions, or a combination of these methods.
- Expression
Specifies a numeric value, an attribute field, or a more complex expression using QGIS expressions.
- Z value / M value
Uses the Z value or M value from the geometry. The value evaluated from the expression is added to the existing value.
These options are available only when the layer geometries contain Z values or M values. They are not available when the shape type is set to Extruded or Overlay.
Material#
- Color
Specifies the color used to render the shapes.
- Opacity
Sets the opacity of the rendered shapes. 100 is fully opaque, and 0 is fully transparent.
Features#
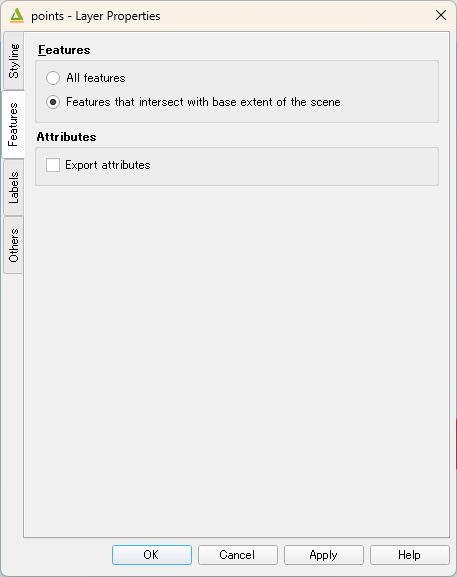
Vector Layer Properties Dialog - Features Tab#
Select the features to export.
- All features
Exports all features in the layer.
- Features that intersect with the base extent of the scene
Exports features that intersect with the scene base extene defined in Scene properties dialog.
- Clip geometries
This option is available with Line and Polygon layers. If checked, geometries are clipped to the base extent of the scene.
Attributes#
- Export attributes
If this option is checked, attributes are exported together with the features. Attributes are displayed when an object is clicked in a web browser.
Labels#
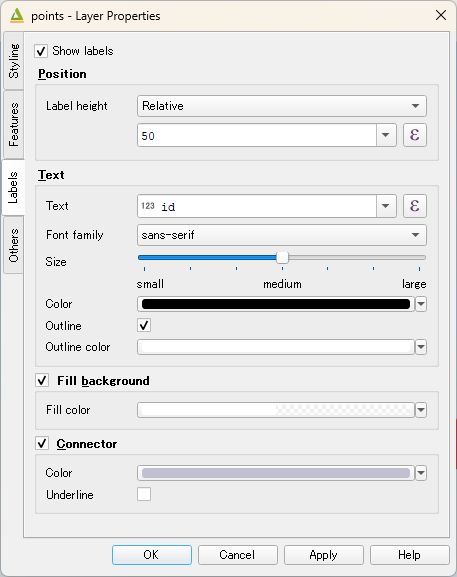
Vector Layer Properties Dialog - Labels Tab#
This tab is not available when the layer type is Line.
- Show labels
Displays a label above each object.
Position#
- Label height
Specifies the height at which labels are displayed. When Absolute is selected, labels are displayed at a fixed height above the zero level. When Relative is selected, label height is determined relative to the corresponding objects.
Text#
- Text
Specifies the label text. An attribute field or a more complex expression can be used.
- Font family
Specifies the font family used for labels.
- Size
Specifies the font size of labels.
- Color
Specifies the color of label text.
- Outline
Enables an outline for label text.
- Outline color
Specifies the color of the label text outline.
Fill Background#
Enables filling the label background.
- Fill color
Specifies the background color.
Connector#
Adds connectors between objects and their labels.
- Color
Specifies the color of the connector.
- Underline
Enables an underline beneath the label.
Others#
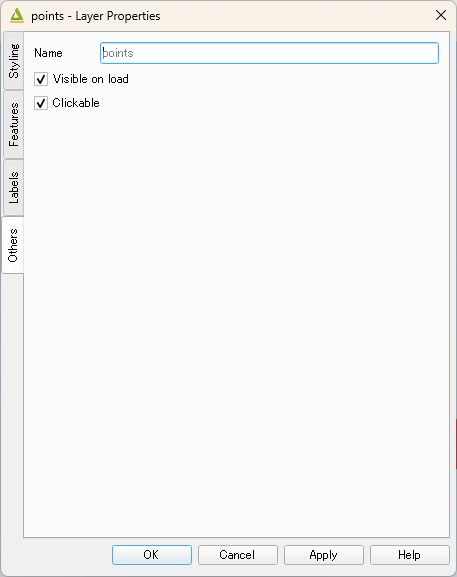
Vector Layer Properties Dialog - Other Options Tab#
- Name
Specifies the name of the vector layer as displayed in the layer list on the exported page.
- Visible on Load
Specifies whether the layer is visible when the exported page is loaded.
- Clickable
Enables user interaction with the layer. When enabled, the layer can respond to click events.
This option is not available when ThickLine is selected.
Point Cloud Layer#
Properties#
Information#
- URL
The source URL of the point cloud.
- Description
Metadata or additional information about the point cloud.
Material#
- Color type
Specifies the method used to color the points.
Other Options#
- Name
Specifies the name of the point cloud layer as displayed in the layer list on the exported page.
- Show bounding boxes
Displays point-cloud bounding boxes in the viewer.
- Visible on load
Specifies whether the layer is visible when the exported page is loaded.
- Clickable
Enables user interaction with the layer. When enabled, the layer can respond to click events.
See also Add Point Cloud Layer….
Animation#
Animation Panel#
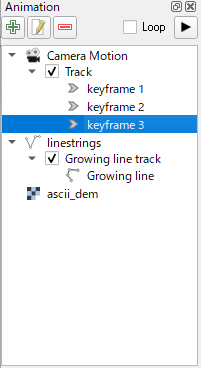
Animation Panel#
The Animation Panel allows you to organize tracks, keyframes, and transition items that make up an animation using a tree widget.
Animation Basics#
Animations such as camera movement, opacity changes, and texture switching require at least two keyframes. A transition is defined by two keyframes that represent the starting and ending states. The growing line animation track is an exception; a transition item is stored under the track instead of keyframes. The types of animation tracks are described later in the Animation Structure section.
Adding Tracks and Keyframes#
Select the track where you want to add a keyframe and click the + button. If no track exists, select a top-level item and click the + button to create a new track. To add animation tracks associated with a layer (e.g. opacity changes), the target layer must be checked in the Layer Panel.
For Camera motion, a keyframe is created using the current camera position and orientation in the preview. For other track types, specify the key value in the dialog that appears (e.g. an opacity value).
Editing Keyframes and Transitions#
Keyframes can be reordered by dragging and dropping them. Double-clicking a keyframe item opens the Keyframe dialog, where you can modify the easing type, the delay before the transition starts, and the transition duration. If text or HTML is entered in the Narrative text box, a pop-up will be displayed at the corresponding keyframe during the animation.
For Camera motion, you can update the camera position and orientation of a keyframe from the context menu.
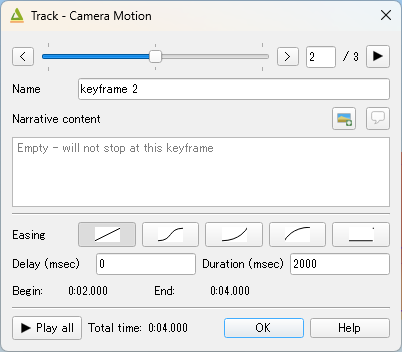
Keyframe Dialog#
Animation Structure#
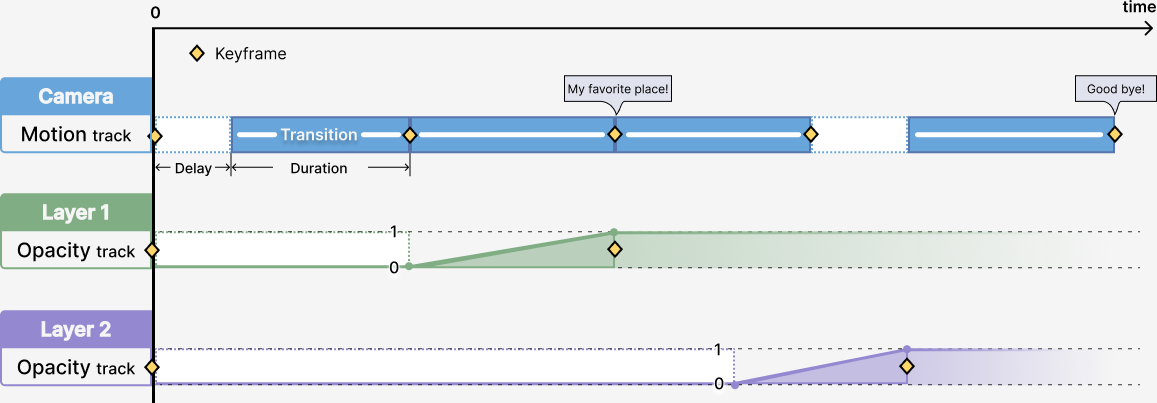
The structure of an animation composed of multiple tracks#
The animation timeline progresses horizontally along the time axis. Each track contains track items that define how properties change over time using delay and transition duration.
Types of Animation Tracks#
This section describes the types of animation tracks available and how each track controls animation behavior.
- Camera Motion Track
This track controls camera movement using multiple keyframes. Each keyframe represents a camera state, and transitions between keyframes define how the camera moves from one state to the next. The timing of each movement is controlled by an initial delay followed by a transition duration. Keyframes are arranged sequentially to create continuous camera motion throughout the animation.
- Opacity Track
This track controls the opacity of a layer.
- Texture Track
This track manages texture switching for a layer.
- Growing Line Track
This track creates an animation in which line strings progressively extend over time. You can choose between two modes: one in which all features grow simultaneously, or another in which each feature extends individually in sequence.
Export to Web Dialog#
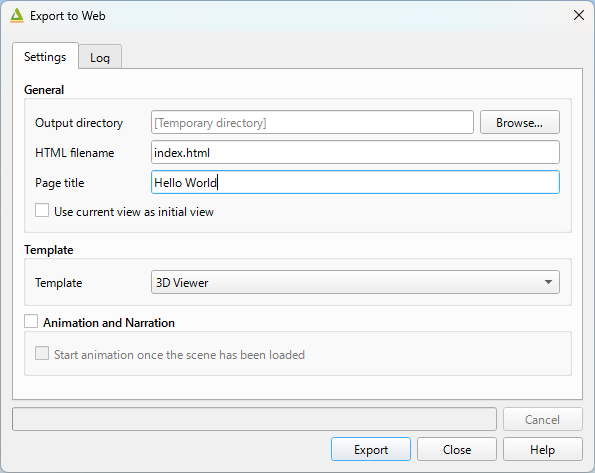
Export to Web Dialog#
- Output directory and HTML filename
Select the output location and filename for the HTML file.
Geometry data and texture image files are exported to a subdirectory with the same name as the HTML file, located under the
datadirectory inside the output directory. Required JavaScript library files are copied into the directory.If this field is left empty, the output will be written to a temporary directory. Temporary files are automatically removed when you close the QGIS application.
- Page title
Specify the title of the exported web page.
- Use current view as initial view
If enabled, the current view shown in the preview at the time of export is saved and used as the initial view when the exported scene is loaded in the viewer.
- Template
Select one of the available templates:
- 3DViewer
This template provides a basic 3D viewer without any additional UI libraries.
- 3DViewer(dat-gui)
This template includes a dat-gui control panel that allows you to toggle layer visibility, adjust layer opacity, and add a horizontally oriented plane that can be moved vertically.
- Animation and Narrative
Enables animations and narrative sequences configured in the animation panel.
- Start animation once the scene has been loaded
If enabled, playback automatically begins after the scene finishes loading.
- Export button
Exporting starts when you press the Export button. The view switches to the Log panel, and once the process is complete, you can open the exported directory by clicking the hyperlink in the log. On Windows, a [View page] hyperlink is also displayed. Clicking this link starts a local web server and opens the exported web page in your default web browser.
- Publish with Qgis2OnlineMap
Added in version 2.10.
This feature allows you to seamlessly share your 3D visualizations on the web using the Qgis2OnlineMap service.
The button appears only after the export process is complete. If the Qgis2OnlineMap plugin is not installed, the button will be disabled. To use this feature, please install the Qgis2OnlineMap plugin via the QGIS Plugin Manager.
Plugin Settings#
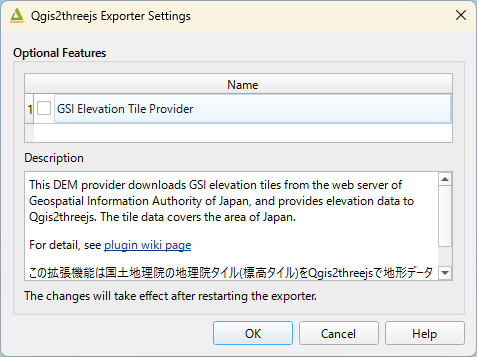
Exporter Settings Dialog#
- Optional Features
See Plugins wiki page.